GuideHow to check your WordPress error log
Last updated: 29 October 2026
When WordPress shows "There has been a critical error on this website", a blank page or a 500 error, PHP writes the reason in your website's error log. This guide shows where to find your WordPress error log in the control panel, how to read it, and how to turn on WordPress's own debug log when you need more. It takes about five minutes.
Open your WordPress error log
- In the control panel, open Websites in the left sidebar and choose your website.
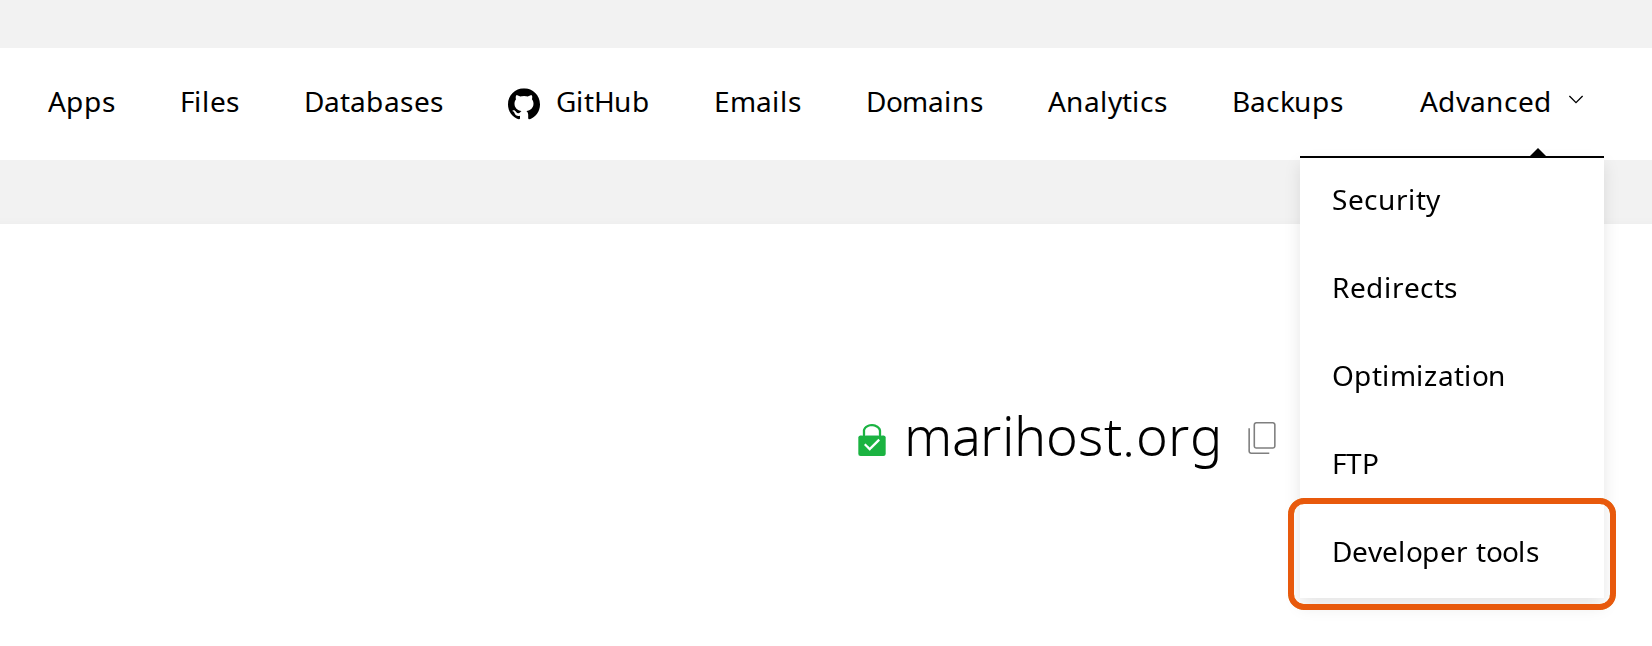
- Click Advanced at the top, then Developer tools.
- Under PHP, scroll down to php-error.log. Click the refresh button next to "Last refreshed" to load the newest errors.
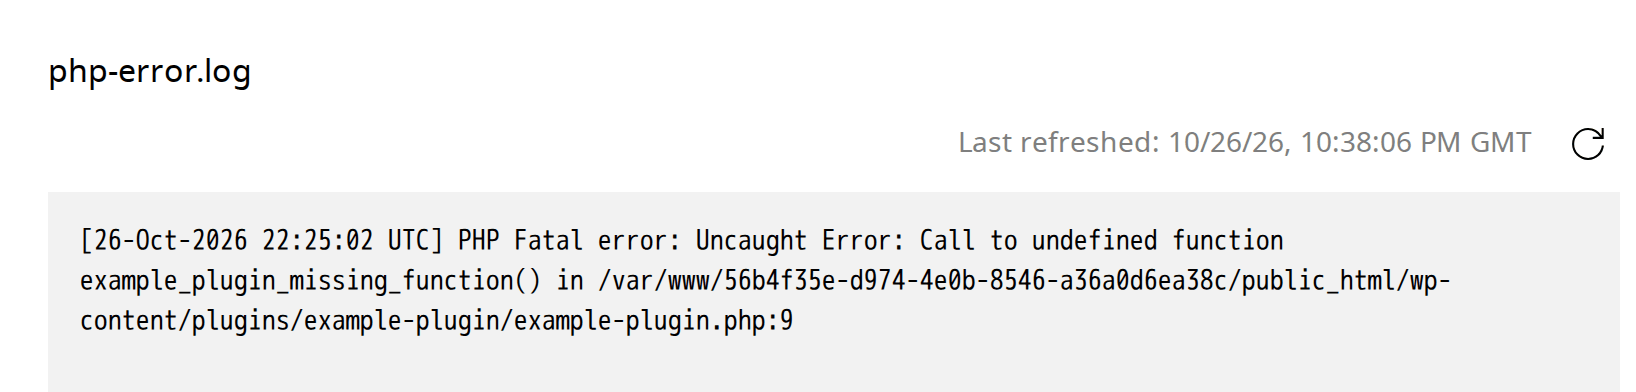
The oldest errors are at the top and the newest at the bottom. The log is also a file, php-error.log, in your website's home folder next to public_html, if you'd rather download it over FTP: see Files: the file manager and FTP.
Read an error
Each error starts with the date and time in UTC, which is 8 hours behind Malaysia and Singapore time, then says what kind of error it is:
- PHP Fatal error stopped the page from loading. This is the one behind a critical error or a blank page.
- PHP Warning, PHP Deprecated and PHP Notice mean a plugin or theme did something it shouldn't, but the page still loaded. Many of them usually mean a plugin or theme is out of date, or older than your PHP version.
The end of the first line names the file, and the folder tells you whose code it is. Look for the name after wp-content/plugins/ or wp-content/themes/: in the picture above, it's the plugin example-plugin. Switch that plugin off (see Deactivate a plugin without logging in), then update it or ask its developer for a fix.
The Stack trace lines below an error show the steps PHP took to get there. You don't need to read them, but copy them along with the error if you ask the plugin's developer or us for help.
When the log is empty
"No PHP errors logged since restart" means PHP hasn't logged an error since it last restarted. Restarting PHP from Developer tools starts a new log, so read the log before you restart.
An empty log with a broken website usually means the problem isn't a PHP error. "Error establishing a database connection", "Too many redirects" and "Briefly unavailable for scheduled maintenance" all have other causes: see Fix common WordPress errors.
WordPress's debug log
WordPress can keep its own log too, with errors and notices from plugins that PHP's log doesn't show. Turn it on when you're chasing a problem:
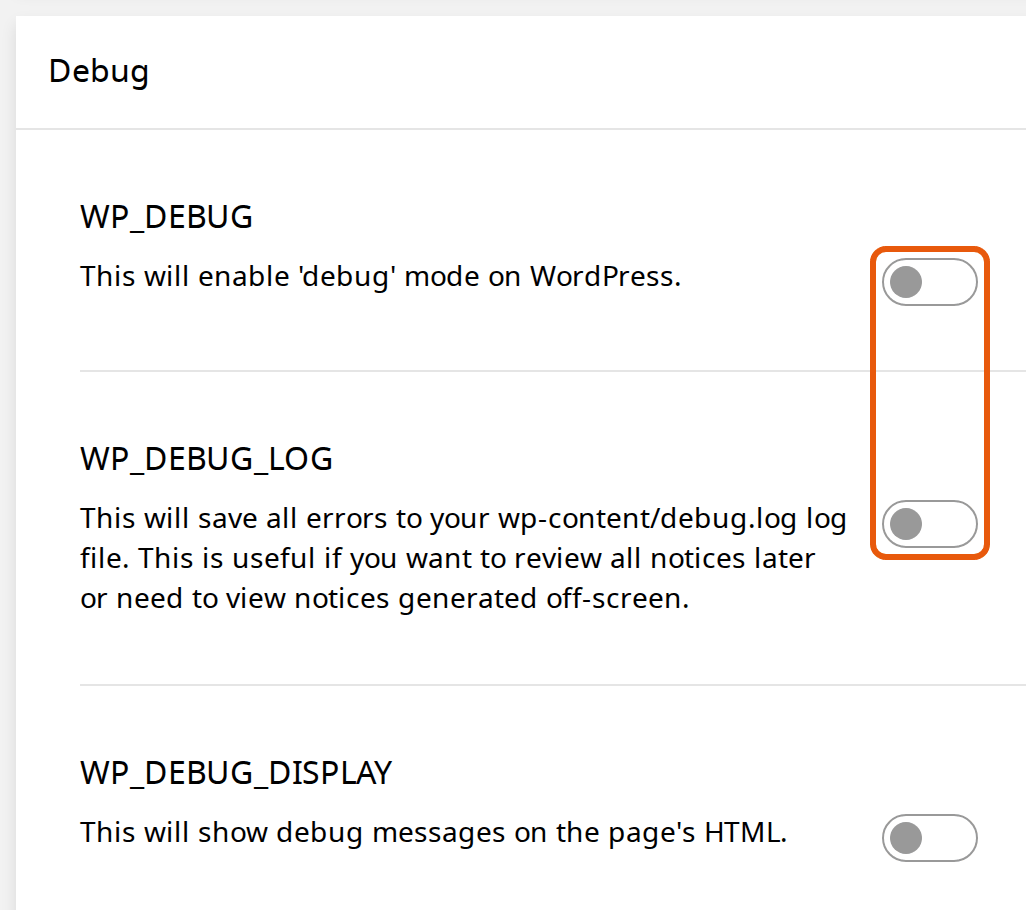
- Open your website's Toolkit (on Apps, next to WordPress) and go to Debug.
- Turn on WP_DEBUG and WP_DEBUG_LOG. Leave WP_DEBUG_DISPLAY off, so visitors don't see the errors on your pages.
- Load the page that has the problem again. WordPress writes what it finds to
wp-content/debug.log: open it with Files in the control panel, underpublic_html, thenwp-content.
When you've finished, turn the switches off and delete debug.log. Anyone who knows its address can open it.
Next steps
Found the plugin behind the error? See Fix common WordPress errors to get your website working again, and Change your PHP version if a plugin needs an older or newer one.
Rather we looked after it?
WordPress Care updates your site, checks it after every update, and fixes anything an update breaks.
Keep reading
Fix common WordPress errors
The critical error, a blank page, database and redirect errors: find the cause and switch it off yourself.
Read the guideDeactivate a plugin without logging in
Switch off the plugin that broke your site from the control panel, even while WordPress shows an error.
Read the guideChange your PHP version
Pick the right version for WordPress, check your site first, and switch back if a plugin complains.
Read the guide